ឯកសារ:Gamma plot.svg
Jump to navigation
Jump to search

Size of this PNG preview of this SVG file: ៦០០ × ៤៨០ ភីកសែ. ភាពម៉ត់ផ្សេងទៀត៖ ៣០០ × ២៤០ ភីកសែ | ៩៦០ × ៧៦៨ ភីកសែ | ១២៨០ × ១០២៤ ភីកសែ | ២៥៦០ × ២០៤៨ ភីកសែ។
រូបភាពដើម (ឯកសារប្រភេទSVG ៦០០ × ៤៨០ ភីកសែល ទំហំឯកសារ៖ ១៣គីឡូបៃ)
ចំណារពន្យល់
| ការពិពណ៌នា |
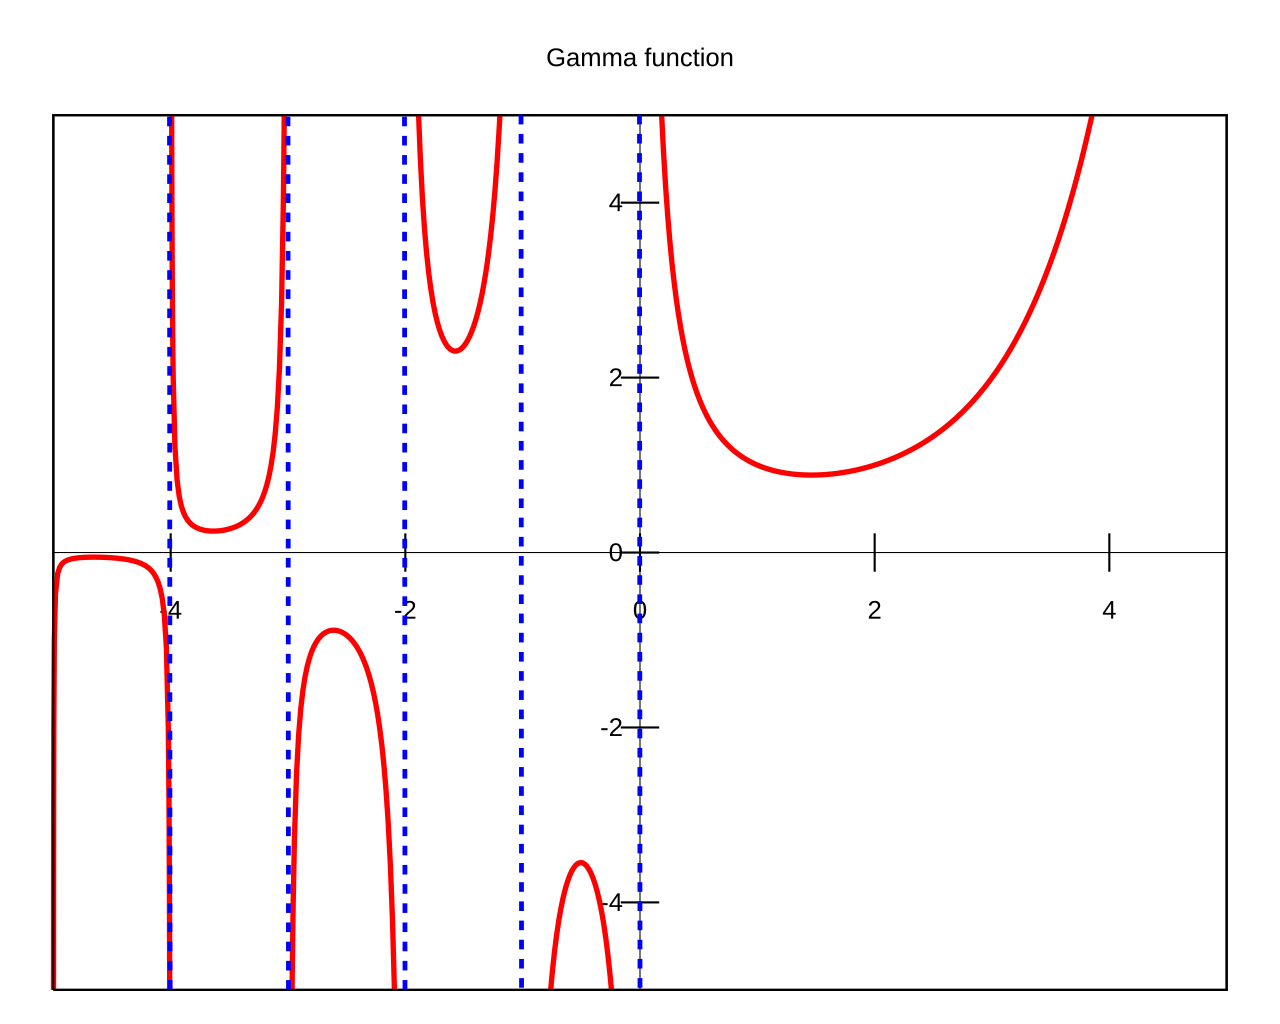
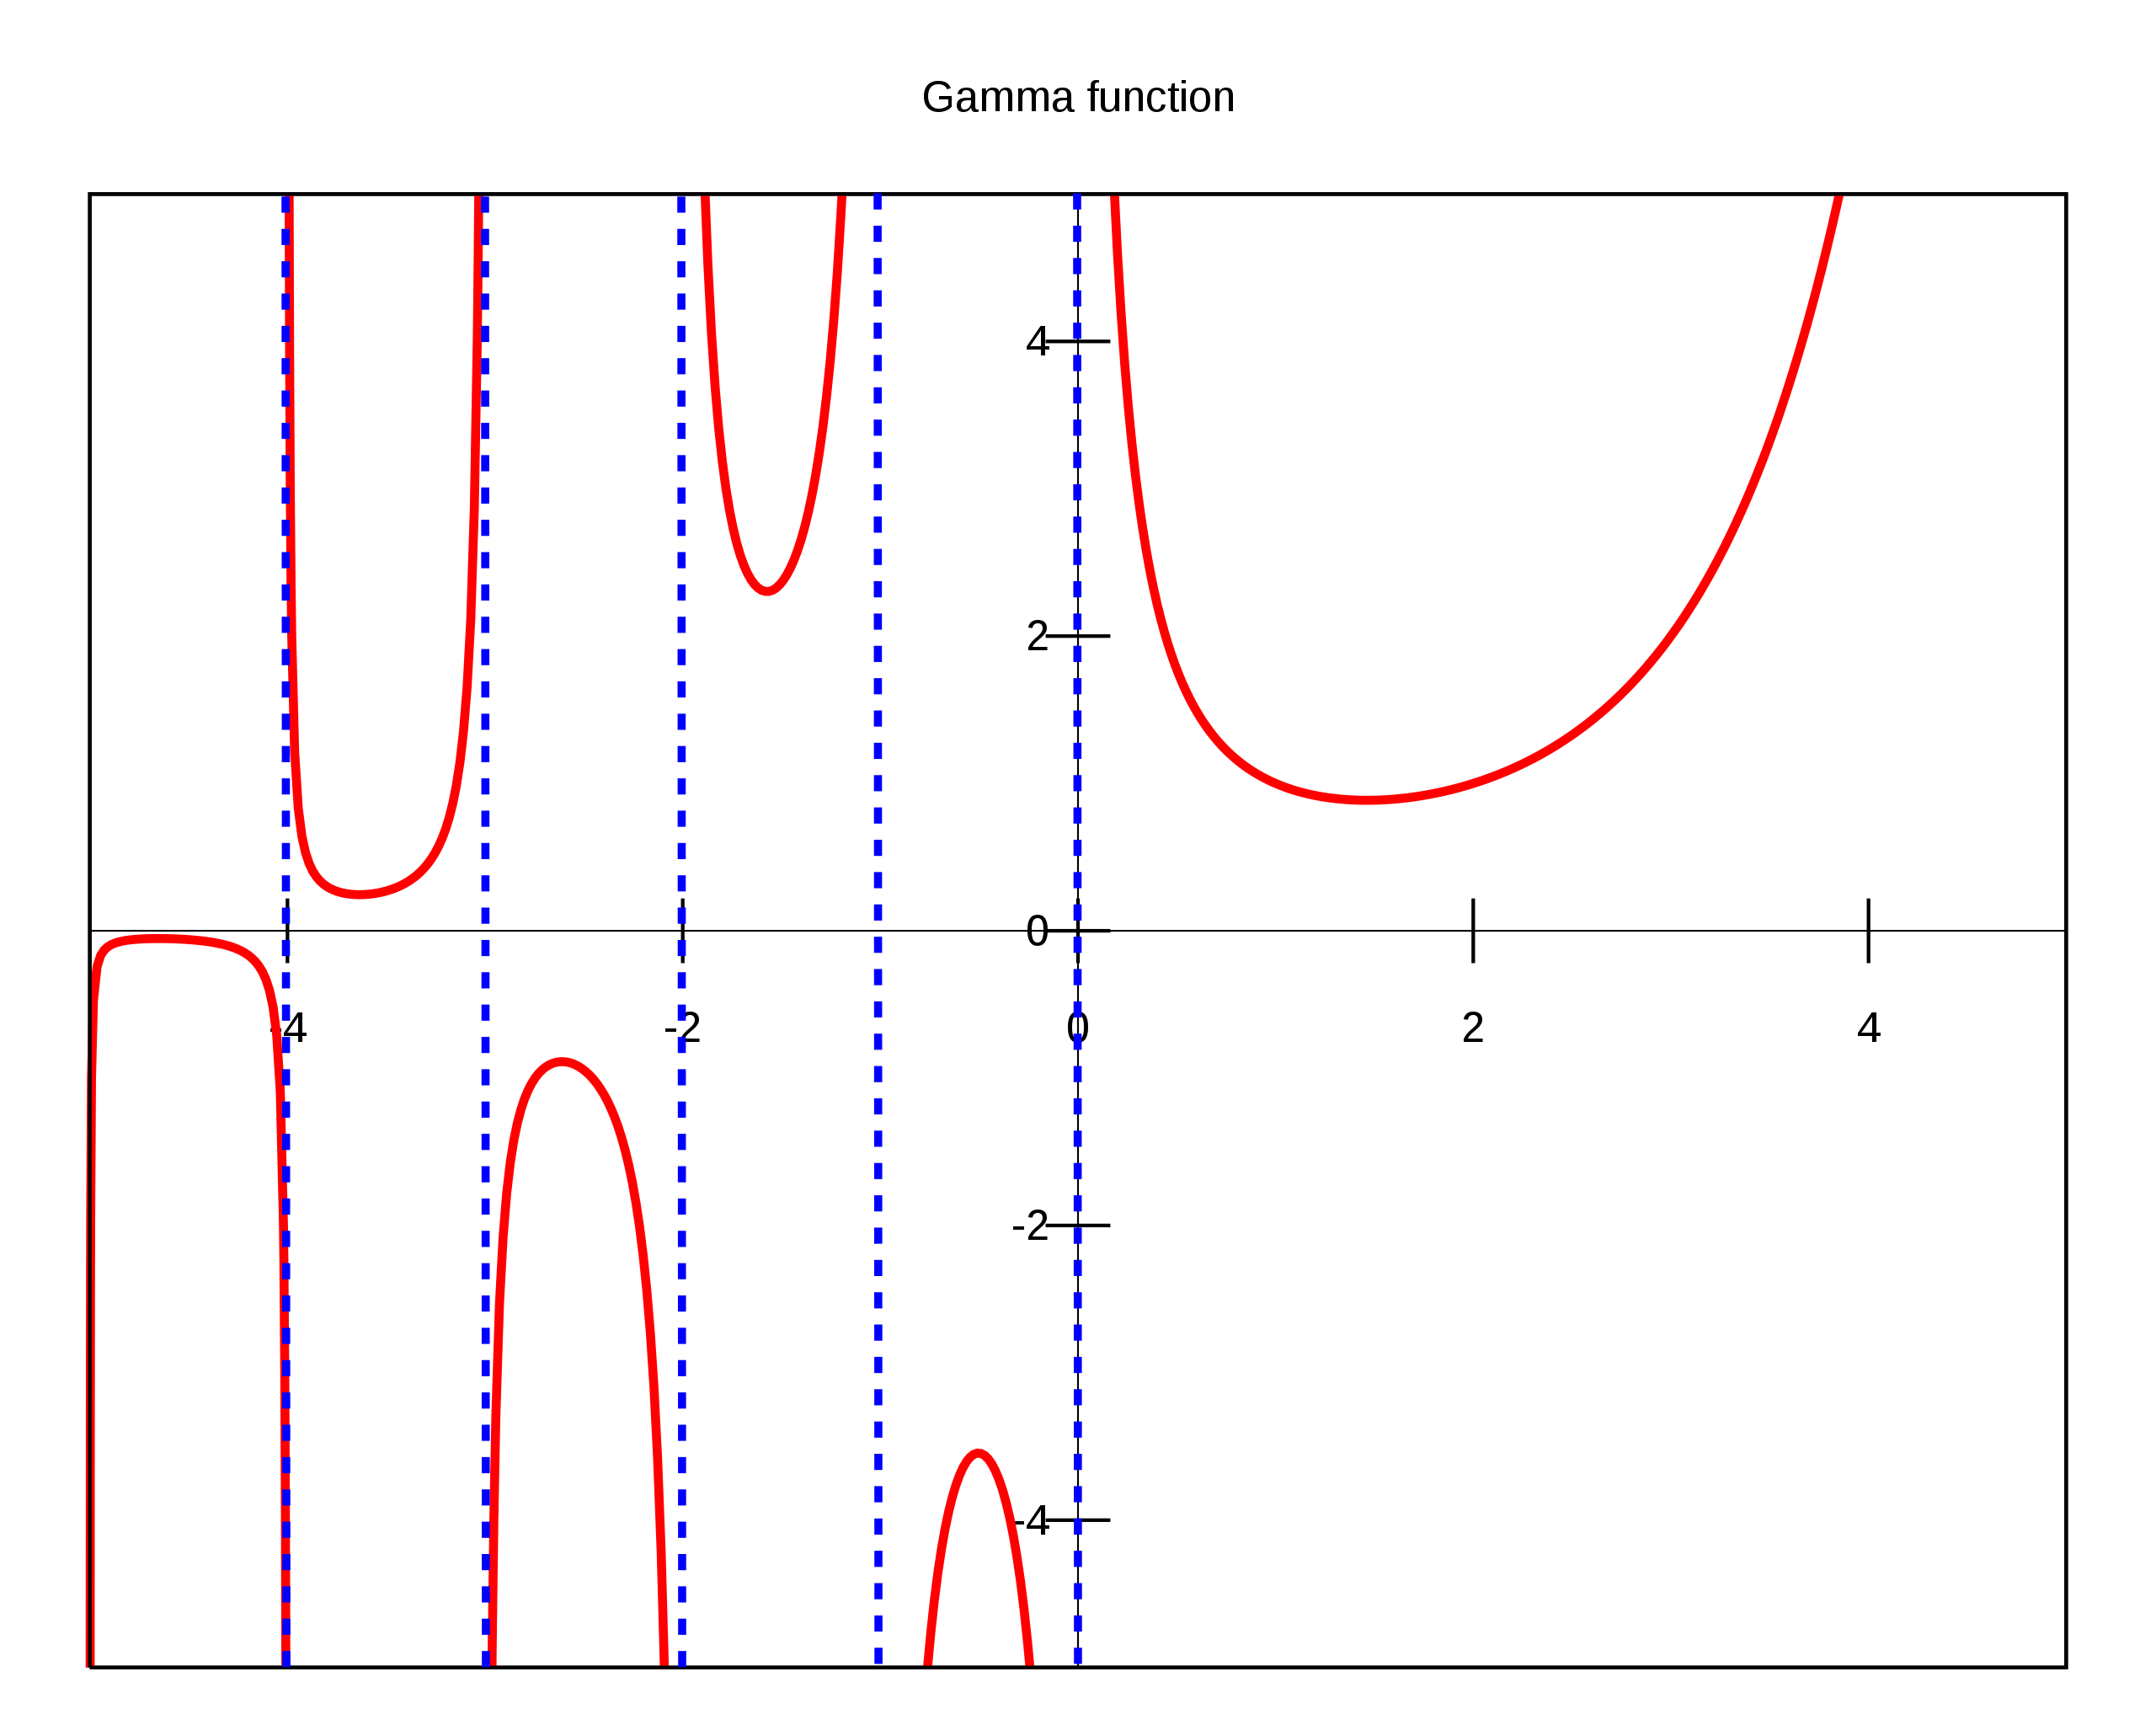
Plot of the Gamma function . The plot was produced running Gnuplot on the following code: set terminal svg set output "Gamma_plot.svg" set title "Gamma function" set xrange [-10:10] set yrange [-10:10] set key off set xzeroaxis linetype -1 linewidth 0.5 set yzeroaxis linetype -1 linewidth 0.5 set xtics axis set ytics axis plot "gamma.dat" using 1:2 with lines linewidth 2 the file "gamma.dat" contains the values of the Gamma function and can be produced with the following Matlab commands (it is meant to work in Octave, too, but it returns an error in version 2.1.64): t = -5:0.01:5; G = [ t; gamma(t) ]; G = G'; save -ascii "gamma.dat" G;it was then post-processed with Sodipodi. |
| កាលបរិច្ឆេទ | |
| ប្រភព | ការងារផ្ទាល់របស់អ្នកផ្ទុកឡើង (Original text: own work) |
| អ្នកនិពន្ធ | Alessio Damato |
| ទំរង់ផ្សេងទៀត |
Derivative works of this file: |
| SVG genesis |

ការដាក់អាជ្ញាប័ណ្ណ
I, the copyright holder of this work, hereby publish it under the following licenses:

|
រូបភាពនៃទំព័រនេះជាកម្មសិទ្ធិរបស់GNU Free Documentation License។ Version 1.2 ឬក៏ខ្ពស់ជាងនេះត្រូវបានឧបត្ថមគាំទ្រដោយ មូលនិធិសូហ្វវែរដោយឥតគិតថ្លៃ (Free Software Foundation) ដែលមិនមានផ្នែកណាមួយរបស់ប្រភពដើមរួមទាំងអក្សរនៅលើគំរបមុខនិងខ្នង ត្រូវបានផ្លាស់ប្តូរទេ។ ចំពោះផ្នែកដែលមិនអាចផ្លាស់ប្តូរបាន សូមមើលGNU Free Documentation License។ |
| ឯកសារនេះជាប់អាជ្ញាបណ្ឌCreative Commons Attribution-Share Alike 3.0 Unported។ | ||
| ||
| This licensing tag was added to this file as part of the GFDL licensing update. |
ឯកសារនេះជាប់អាជ្ញាបណ្ឌCreative Commons Attribution-Share Alike 2.5 Generic, 2.0 Generic និង 1.0 Generic។
- អ្នកមានសិទ្ធិ៖
- ចែកចាយ – ថតចំលងនិងចែកចាយស្នាដៃនេះ
- កែច្នៃ – កែច្នៃយកទៅប្រើ
- ក្រោមលក្ខខណ្ឌដូចតទៅនេះ៖
- ភាពជាម្ចាស់កម្មសិទ្ធ – You must give appropriate credit, provide a link to the license, and indicate if changes were made. You may do so in any reasonable manner, but not in any way that suggests the licensor endorses you or your use.
- share alike – If you remix, transform, or build upon the material, you must distribute your contributions under the same or compatible license as the original.
You may select the license of your choice.
ប្រវត្តិឯកសារ
ចុចលើម៉ោងនិងកាលបរិច្ឆេទដើម្បីមើលឯកសារដែលបានផ្ទុកឡើងនៅពេលនោះ។
| ម៉ោងនិងកាលបរិច្ឆេទ | កូនរូបភាព | វិមាត្រ | អ្នកប្រើប្រាស់ | យោបល់ | |
|---|---|---|---|---|---|
| បច្ចុប្បន្ន | ម៉ោង១៧:៥៦ ថ្ងៃសៅរ៍ ទី១៨ ខែឧសភា ឆ្នាំ២០២៤ | | ៦០០ × ៤៨០ (១៣គីឡូបៃ) | wikimediacommons>संजीव कुमार | File uploaded using svgtranslate tool (https://svgtranslate.toolforge.org/). Added translation for hi. |
បម្រើបម្រាស់ឯកសារ
ទំព័រ ខាងក្រោមប្រើប្រាស់ឯកសារនេះ ៖