ឯកសារ:Trigonometric functions.svg
Jump to navigation
Jump to search

Size of this PNG preview of this SVG file: ៧៤៤ × ៤៨៥ ភីកសែ. ភាពម៉ត់ផ្សេងទៀត៖ ៣២០ × ២០៩ ភីកសែ | ៦៤០ × ៤១៧ ភីកសែ | ១០២៤ × ៦៦៨ ភីកសែ | ១២៨០ × ៨៣៤ ភីកសែ | ២៥៦០ × ១៦៦៩ ភីកសែ។
រូបភាពដើម (ឯកសារប្រភេទSVG ៧៤៤ × ៤៨៥ ភីកសែល ទំហំឯកសារ៖ ២៣គីឡូបៃ)
ចំណារពន្យល់
| ការពិពណ៌នា |
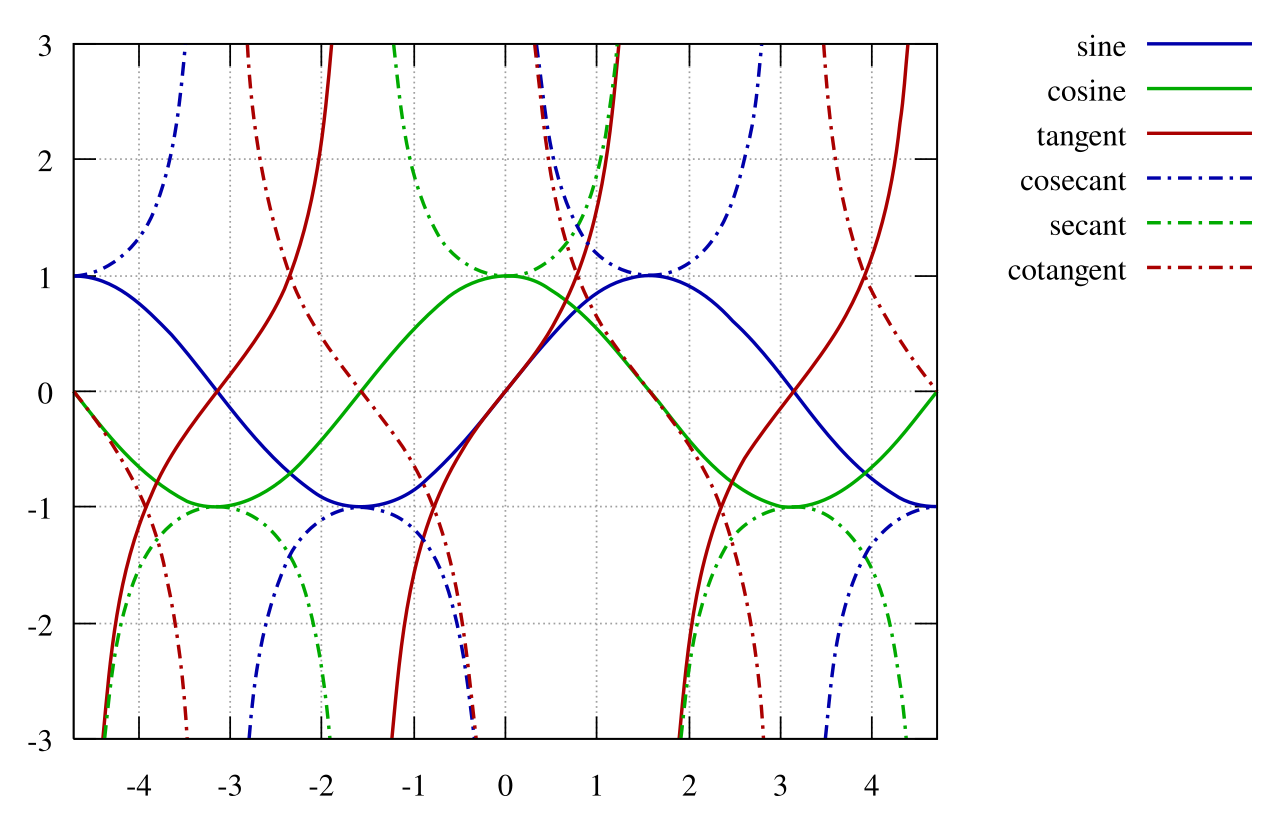
English: An image showing the trigonometric functions on 2d space:
I created it with the following Gnuplot code:
set terminal svg enhanced fname "Times" fsize 18 set output "trigonometric_functions.svg"
set xrange [-1.5*pi:1.5*pi] set yrange [-3:3] set grid xtics ytics set key 7,3 plot sin(x) title "sine" with lines linewidth 2,\ cos(x) title "cosine" with lines linewidth 2,\
tan(x) title "tangent" with lines linewidth 2,\
1/cos(x) title "secant" with lines linewidth 2,\
1/sin(x) title "cosecant" with lines linewidth 2,\
1/tan(x) title "cotangent" with lines linewidth 2
</source> then I heavily post-processed with Inkscape. |
| កាលបរិច្ឆេទ | |
| ប្រភព | own work, made with Gnuplot and post-processed with Inkscape |
| អ្នកនិពន្ធ | Alessio Damato |
| ទំរង់ផ្សេងទៀត | it's an improved version of Trigonometric-functions-thick.gif |
| SVG genesis |
ការដាក់អាជ្ញាប័ណ្ណ
I, the copyright holder of this work, hereby publish it under the following licenses:

|
រូបភាពនៃទំព័រនេះជាកម្មសិទ្ធិរបស់GNU Free Documentation License។ Version 1.2 ឬក៏ខ្ពស់ជាងនេះត្រូវបានឧបត្ថមគាំទ្រដោយ មូលនិធិសូហ្វវែរដោយឥតគិតថ្លៃ (Free Software Foundation) ដែលមិនមានផ្នែកណាមួយរបស់ប្រភពដើមរួមទាំងអក្សរនៅលើគំរបមុខនិងខ្នង ត្រូវបានផ្លាស់ប្តូរទេ។ ចំពោះផ្នែកដែលមិនអាចផ្លាស់ប្តូរបាន សូមមើលGNU Free Documentation License។ |
| ឯកសារនេះជាប់អាជ្ញាបណ្ឌCreative Commons Attribution-Share Alike 3.0 Unported។ | ||
| ||
| This licensing tag was added to this file as part of the GFDL licensing update. |
ឯកសារនេះជាប់អាជ្ញាបណ្ឌCreative Commons Attribution-Share Alike 2.5 Generic, 2.0 Generic និង 1.0 Generic។
- អ្នកមានសិទ្ធិ៖
- ចែកចាយ – ថតចំលងនិងចែកចាយស្នាដៃនេះ
- កែច្នៃ – កែច្នៃយកទៅប្រើ
- ក្រោមលក្ខខណ្ឌដូចតទៅនេះ៖
- ភាពជាម្ចាស់កម្មសិទ្ធ – You must give appropriate credit, provide a link to the license, and indicate if changes were made. You may do so in any reasonable manner, but not in any way that suggests the licensor endorses you or your use.
- share alike – If you remix, transform, or build upon the material, you must distribute your contributions under the same or compatible license as the original.
You may select the license of your choice.
ប្រវត្តិឯកសារ
ចុចលើម៉ោងនិងកាលបរិច្ឆេទដើម្បីមើលឯកសារដែលបានផ្ទុកឡើងនៅពេលនោះ។
| ម៉ោងនិងកាលបរិច្ឆេទ | កូនរូបភាព | វិមាត្រ | អ្នកប្រើប្រាស់ | យោបល់ | |
|---|---|---|---|---|---|
| បច្ចុប្បន្ន | ម៉ោង២០:៤៩ ថ្ងៃអង្គារ ទី០៣ ខែធ្នូ ឆ្នាំ២០២៤ | | ៧៤៤ × ៤៨៥ (២៣គីឡូបៃ) | wikimediacommons>GKNishimoto | File uploaded using svgtranslate tool (https://svgtranslate.toolforge.org/). Added translation for pt-br. |
បម្រើបម្រាស់ឯកសារ
ទំព័រ ខាងក្រោមប្រើប្រាស់ឯកសារនេះ ៖